
Our Te Pūrongo Whakakitenga / Data & Insights Report
Network for Learning’s (N4L) Data & Insights Report shows New Zealand schools face ever increasing threats to online safety and security. This report outlines how we connect, protect and support New Zealand ākonga learning online.
Download the report to find out where schools are spending their time online, what type of data is being consumed and where, and what type of online threats are being blocked across our network.

Security Threats
2.3 Million online security threats blocked every school day

Instant Messsaging
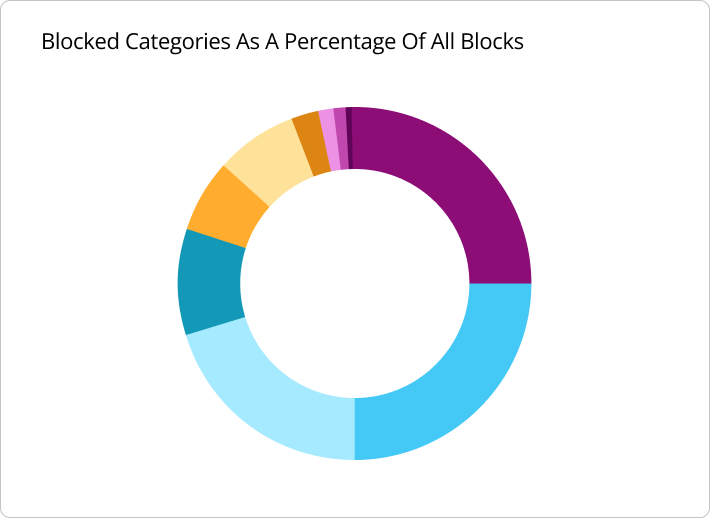
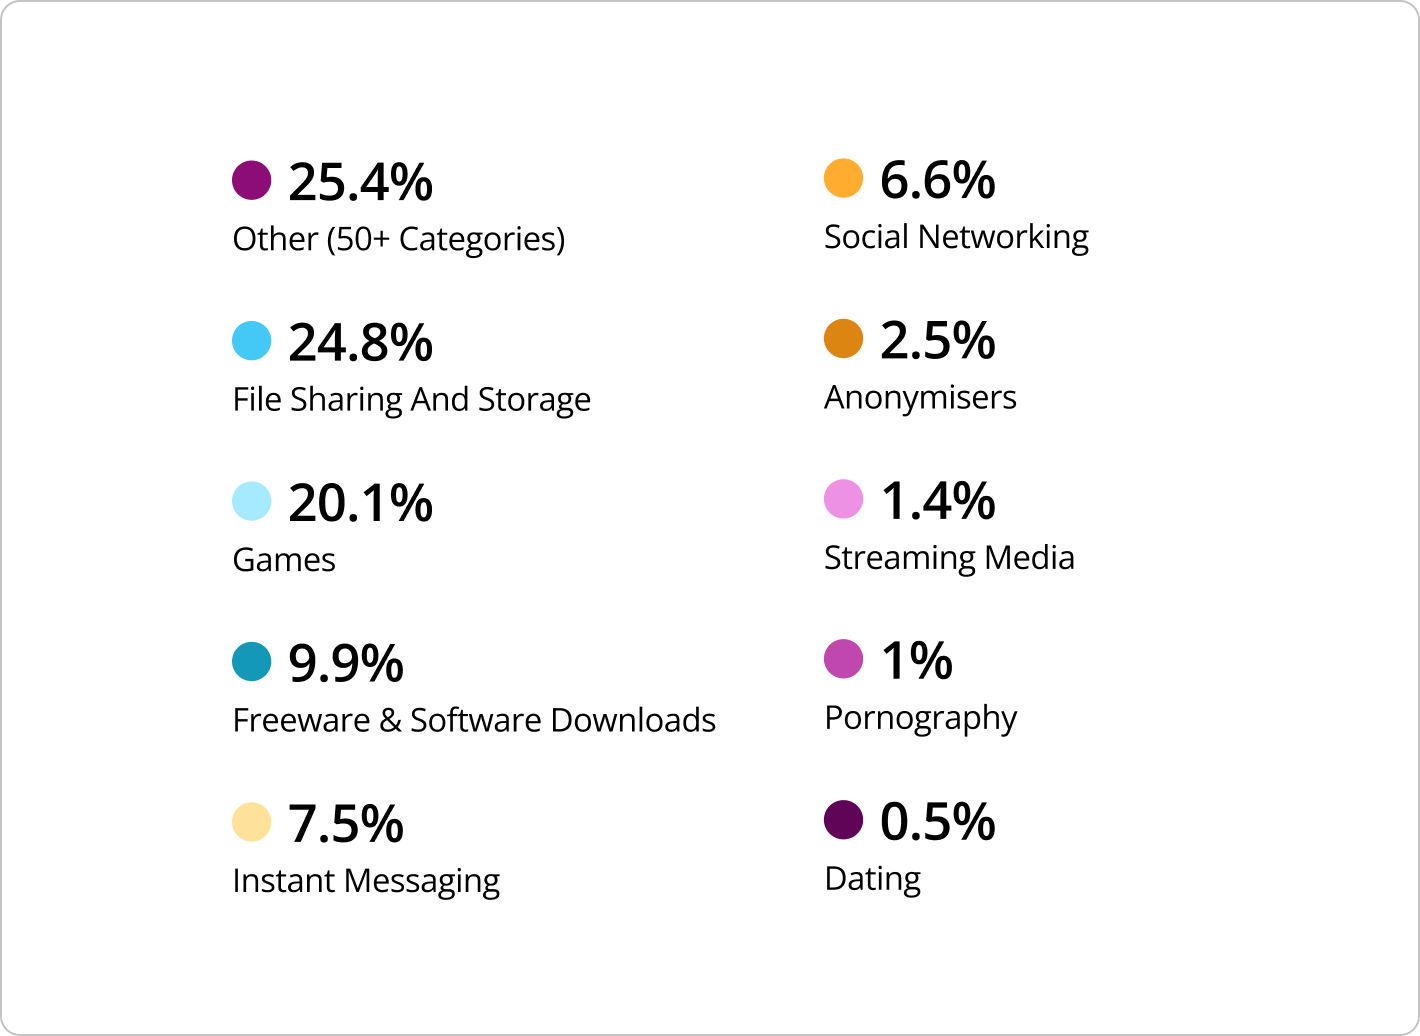
Instant messaging represents 7.5% of all blocked websites

High Usage
Data use jumped 32% despite an Auckland lockdown in August

Streaming
Streaming media comprises 24% of all data consumed

Gaming
Gaming sites represent 20% of all websites blocked
Connect — Tūhono
Daily data use for students
 32%
32%
Data use jumped 32% since the
first half of the school year.
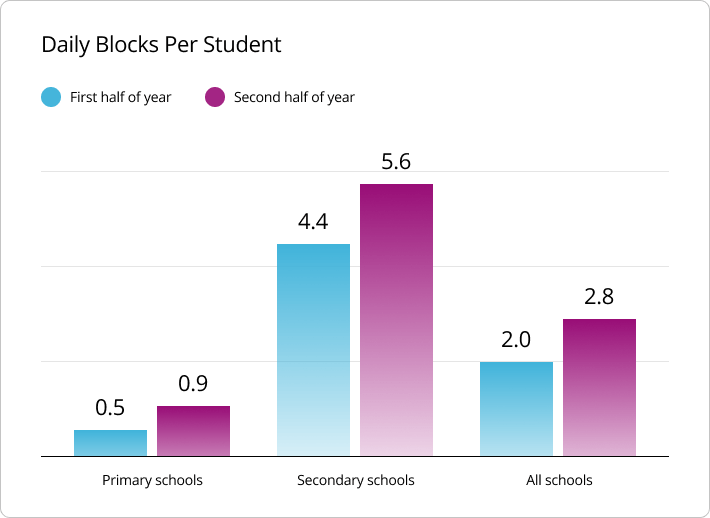
Data use jumped 32% since the first half of the school year. And secondary school students continued to consume twice as much data as primary students with 2.5 times more data consumed.
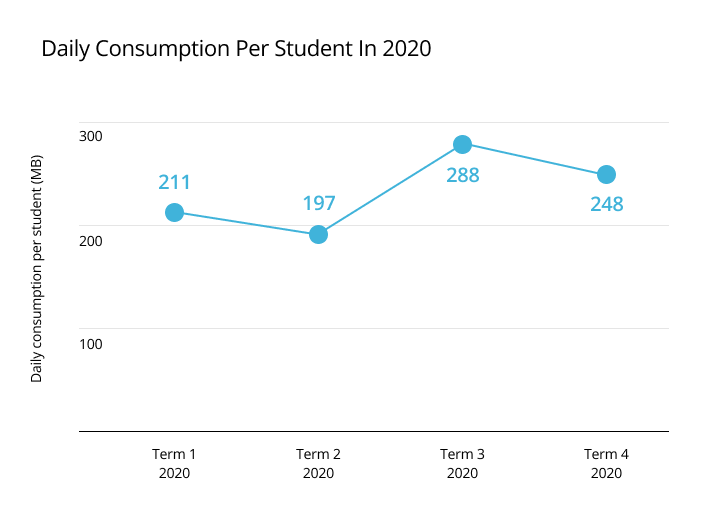
Every day, a student typically consumed 268 megabytes (MB) of data. That’s the equivalent of each student streaming over 2 hours of music a day.
Top 10 Education Related Websites Measured By Browsing Time (Primary Education)
| Hāpara Teacher Dashboard | 39.1% |
| Seesaw | 7.7% |
| eTAP | 7.1% |
| Epic | 5.4% |
| Grammarly | 4% |
| Prodigy Education | 3.9% |
| Linc-Ed | 3.8% |
| 3P Learning | 2.9% |
| G Suite for Education (Google) | 2.8% |
| Kahoot | 2.2% |
Top 10 Education Related Websites Measured By Browsing Time (Secondary Education)
| Hāpara Teacher Dashboard | 33.4% |
| Grammarly | 15.0% |
| G Suite for Education (Google) | 11.6% |
| school.nz | 5.2% |
| Texthelp | 4.5% |
| Language Perfect | 3.6% |
| Education Perfect | 3.1% |
| Kahoot | 2.2% |
| govt.nz | 1.6% |
| Seesaw | 1.5% |
Language learning websites featured more prominently than online maths. And collaboration platforms were among the most popular education websites (Hāpara’s Teacher Dashboard, Seesaw, and Linc-Ed).
Note: Some of the websites listed might be ‘always on’ in the background, as they are a tool for facilitating or administering education activity. In general, these tools may run applications that may be active all day and outside of school hours.
Protect — Tiaki
Safe & Secure Internet in Schools — Haumaru me te ārai i ngā Ipurangi
 17%
17%
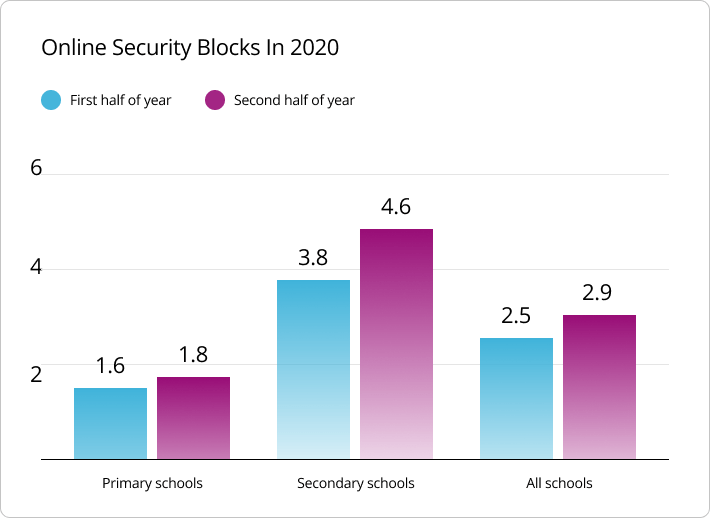
We blocked 17% more online
threats in the second half of the
year than we did in the first half.
1,529 blocks
per minute
There were 2.2 million safety blocks per
school day, or 1,529 per minute.
All websites blocks per school day
All information in this report is aggregated and no school or individual can be identified. You can find out more about how N4L collects and uses data from the Managed Network in our Privacy Statement.
N4L’s Managed Network internet services are used by all state and state-integrated schools. When school internet users visit and search for websites, the amount of data consumed, and where it stems from (website domains), is collected in accordance with our Privacy Statement. Data consumption includes automated traffic such as software updates.
